
The Hull Truth: New Research Puts a Number on Marine Growth
1 December 2024 · MarineStream
Everyone in shipping knows fouling costs money. Until recently, nobody could tell you how much for a given hull.
University of Melbourne researchers have now measured it, using underwater surface scanning to link real hull roughness to real drag [1]. The short version: even a light slime layer costs you fuel, and the penalty is bigger than most operators assume.
A vessel carrying heavy calcareous fouling (FR5) showed a 193% increase in frictional resistance. On the 93-metre cruise ship studied, holding cruise speed with that hull cost $1,273 an hour in fuel and put out an extra 1.8 tonnes of CO₂ [1]. Light slime (FR1) alone adds about 10% to fuel consumption, and moderate slime (FR2) adds 20–30% [1].
What the research found
- Light biofilm (FR1): up to 10% more fuel [1]
- Moderate slime (FR2): 20–30% more fuel [1]
- Heavy calcareous growth (FR4–FR5): 45–60% more fuel [1]
- Speed: because resistance scales with the cube of speed, the penalty gets much worse the faster you push [1]
A separate tugboat study in December 2024 measured moderate fouling causing a 110% increase in skin friction coefficient and a 58% increase in total resistance at 8 knots. That worked out to $292 an hour in fuel and 0.4 tonnes of CO₂ an hour [2]. Shipping accounts for roughly 3% of global CO₂ emissions, so numbers like these now matter for the IMO's carbon intensity indicator as well as for the fuel bill [3].
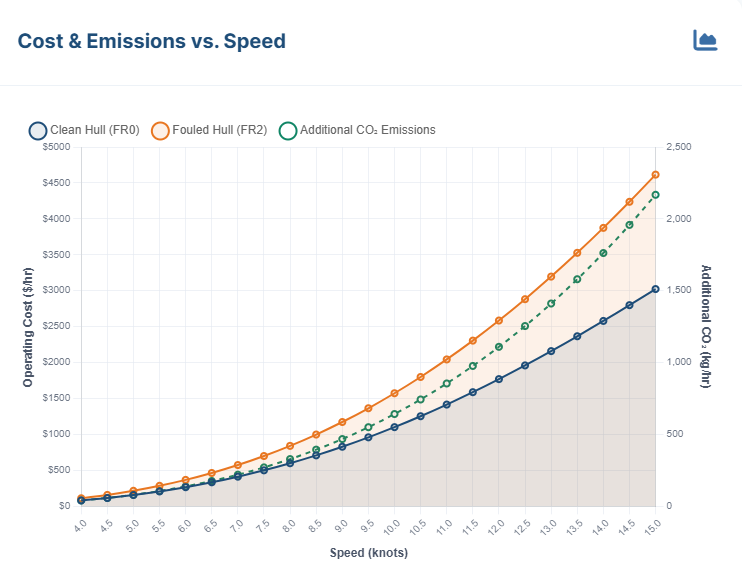 Operating cost and CO₂ emissions against speed, for clean and fouled hulls.
How they measured it
The scanning system is called AQUAMARS (Advanced Quality Underwater Mapping and Analysis for Rough Surfaces). A diver runs it over the hull, eight high-resolution cameras build a 3D reconstruction of the surface to sub-millimetre accuracy, and from that you get equivalent sandgrain roughness (ks), which maps directly onto a drag penalty [2].
That last step is what makes the work useful. Roughness measurements on their own are academic. Turning them into a drag figure means you can put a dollar value on a hull condition, and fouling turns out to hit both frictional resistance and wave-making resistance.
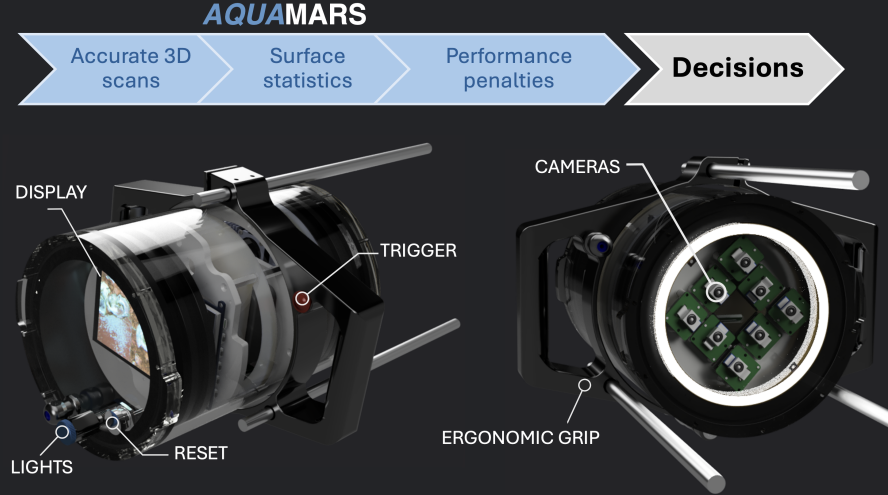 AQUAMARS capturing surface roughness on a tugboat hull during the University of Melbourne study.
What to do about it
The research points at four things worth doing [1, 2, 4]:
- Inspect regularly. ROV or diver inspections catch fouling early, while it is still cheap to remove. Left alone, both the growth and the cost run away from you.
- Clean gently. The cruise ship study suggested timely intervention could save $3 million a year in fuel [1]. That only holds if the cleaning does not wreck the coating in the process.
- Do the propeller too. Combining propeller maintenance with hull cleaning compounds the efficiency gain, on naval and commercial vessels alike [4].
- Track speed and power. Continuous monitoring shows efficiency dropping before anyone notices it on the bridge, which is what lets you plan a clean rather than react to one.
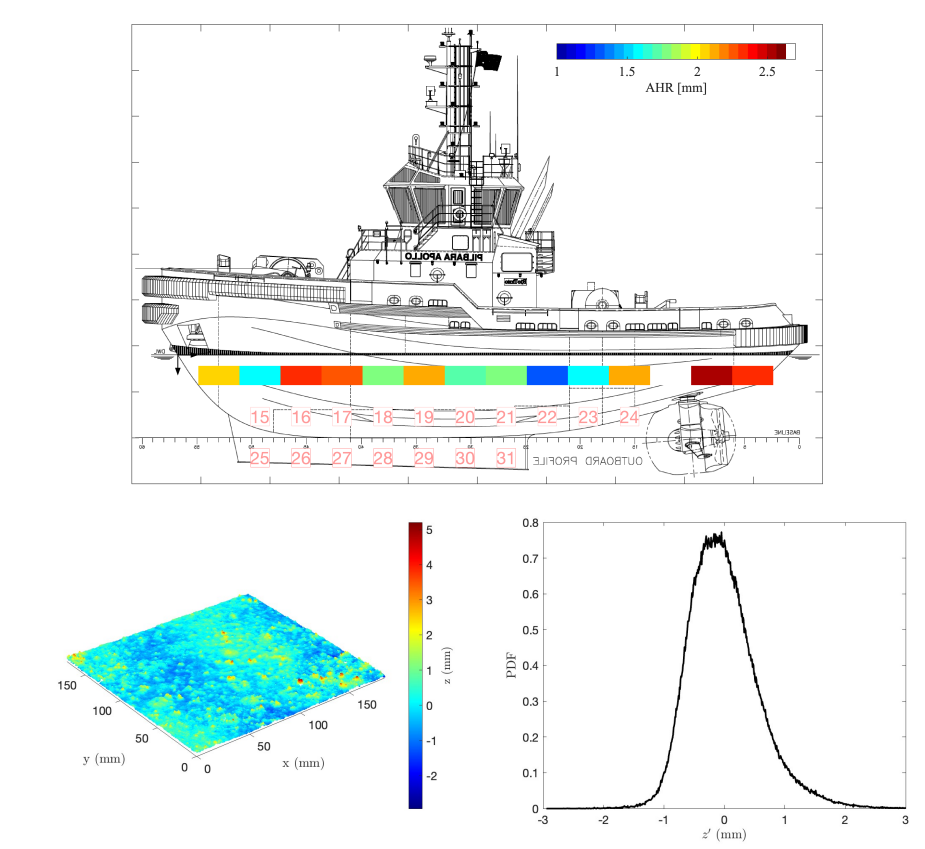 The 3D surface maps show how uneven fouling actually is, which is what makes precise drag calculations possible.
What it costs across a fleet
A commercial vessel operating 200 days a year with moderate to heavy fouling is looking at $2–3 million in extra fuel. Scaled across the world fleet, that runs into tens of billions annually, most of which ends up in shipping rates. Every percentage point of extra resistance is also extra emissions, which is why hull condition has become a decarbonisation issue rather than just a maintenance one.
Ongoing work is looking at other vessel types, operating conditions and fouling patterns, with real-time monitoring and predictive models to follow.
We have put the research into an online Fouling Cost Calculator. Enter your vessel parameters and a fouling condition and it will estimate the fuel penalty and emissions. It gets more accurate as more vessels are scanned.
In naval service
The Royal Australian Navy has taken up evidence-based hull maintenance, including work with Franmarine that put underwater scanning into an operational maintenance program. That matters for two reasons: it keeps ships available, and it holds Australia's biosecurity line at the same time. It also gives the rest of the industry a working example rather than a research paper.
Where this leaves operators
Fuel is expensive, the regulations are tightening, and the performance penalty is now measurable. The argument for moving from fixed maintenance intervals to condition-based hull management has stopped being theoretical.
Doing it properly means investing in underwater assessment, performance monitoring, and cleaning thresholds set by measured resistance rather than by the calendar. The technology exists and the economics are documented. What is left is deciding how quickly to act on it.
References
- [1] L. Tsigaras, A. Kogios, J. Monty (2025). "Quantitative assessment of increased frictional drag due to hull fouling using underwater surface scanning - Coral Adventurer Study." University of Melbourne & Franmarine Underwater Services.
- [2] Kevin, L. Tsigaras, A. Kogios, J. Monty (2024). "Quantitative assessment of increased frictional drag due to hull fouling using underwater surface scanning - Rio Tinto Tugboat Study." University of Melbourne.
- [3] International Maritime Organization (2023). "Guidelines for the control and management of ships' biofouling to minimize the transfer of invasive aquatic species (MEPC.378(80))."
- [4] Schultz, M.P., Bendick, J.A., Holm, E.R. & Hertel, W.M. (2011). "Economic impact of biofouling on a naval surface ship." Biofouling, 27(1), 87-98.
About the author
Mathew Harvey is Biofouling Manager at Franmarine and CTO of MarineStream. He runs biofouling control strategy and the rollout of hull cleaning technology across both businesses, and is based in Western Australia.
For enquiries, contact Adam Falconer-West, CEO:
More from the news
From ROV Controls to a Remote Job in Sydney: Nine Months at MarineStream
Nine months from no practical experience to flying ROVs, running filtration systems and joining an inspection in Sydney from a desk in Perth.
The Preventive Advantage: Biofouling Management in a Warming Ocean
Warmer water is accelerating fouling and corrosion, which makes fixed maintenance intervals a bad bet.